All animations presented here have been created using WinSANAL system. Currently we work on some new animations. We have a lot of animations not shown below; we will publish them here. So revisit this place if you like it!
Animations:
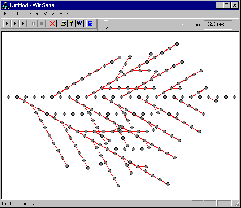
Simulation of the behaviour of an evolution system
Hash table access
Translation to
Reverse Polish Notation
See also Algorithm Animation main page.
Simulation of the behaviour of an evolution system

The images below present two approaches to the hash array problem:
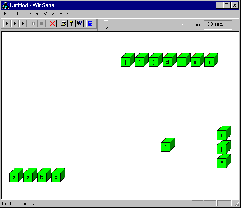
The upper picture shows detailed view of an algorithm. Such visualization is appropriate only for relatively small arrays. It may be well applied for educational purposes, but for programmers it may be usefull only for early stages of algorithm development.

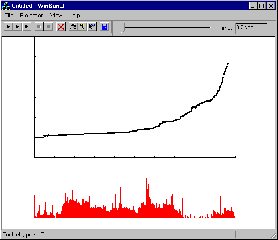
The picture below presents a visualization of the same algorithm applied to a large input data set. It is not detailed any more; instead a higher level of abstraction gives a software engineer some analytic information. In fact, picture shows two different visualizations: in the lower part of screen a histogram of hash function hits for consecutive items is displayed. The diagram in the upper part shows average number of conflicts in function of factor of fullness of array (percent of occupied items in the array).

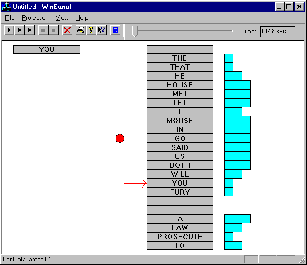
Translation to Reverse Polish Notation
